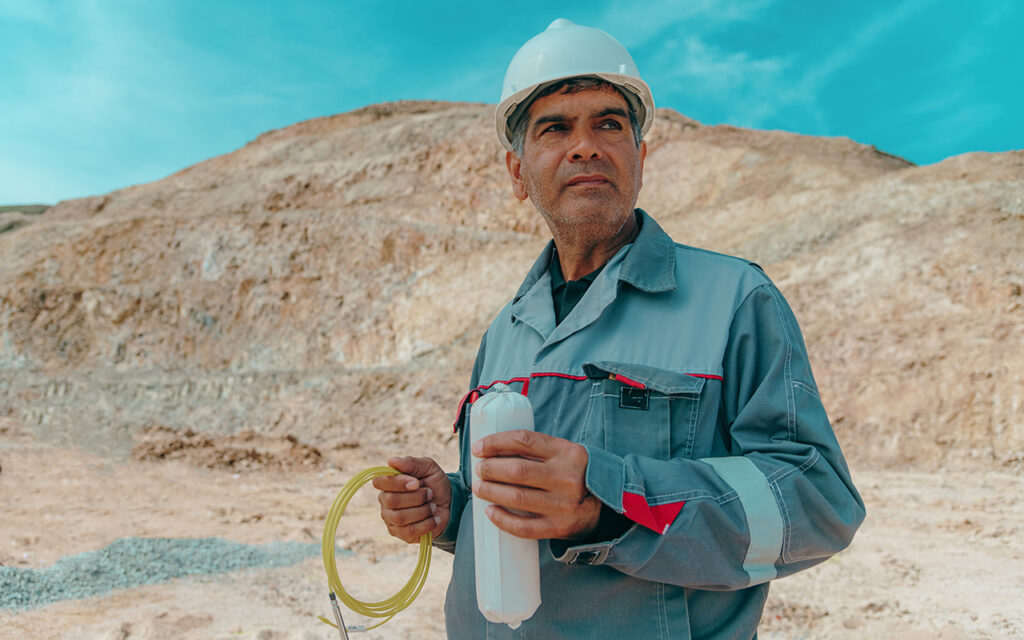
Gedabek is the main mining concession where production has historically taken place.
It hosts the Gedabek open pit and the contiguous Gedabek and Gadir underground mines. Gilar, a new underground copper-gold mine, started production in May 2025. The Zafar deposit is also located at Gedabek but is not currently being developed as the Company currently has sufficient ore feedstock from its existing mines.
300 km2
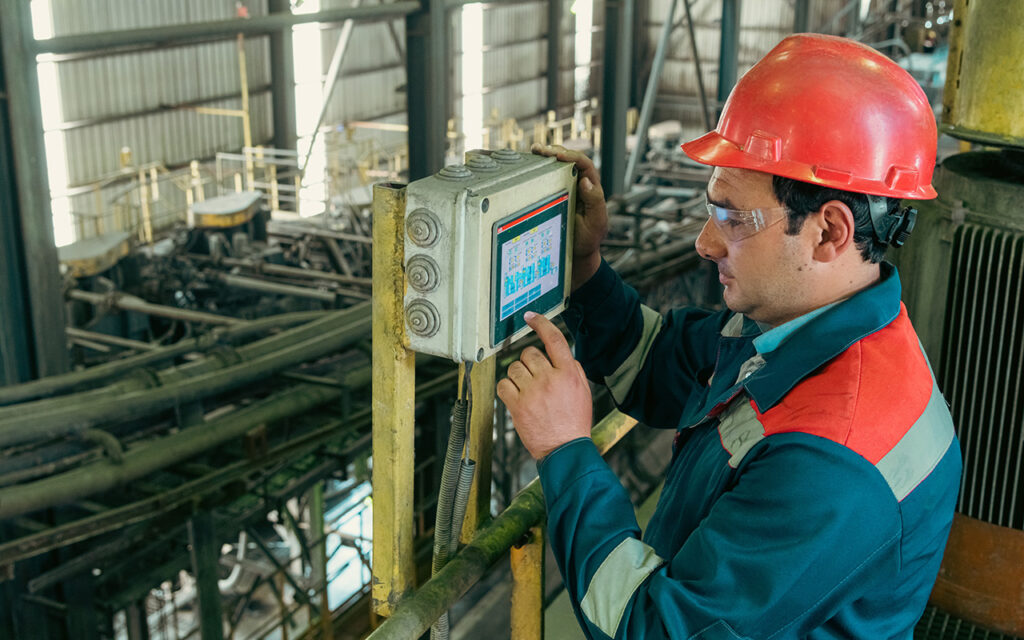
All processing facilities are currently located at Gedabek which comprise an agitation leaching plant, a flotation plant and SART processing. The capacity of the flotation plant was doubled in 2023. Heap leaching is also carried out using both crushed and ROM ore.
Gedabek is now a very mature site with excellent road access, power from the Azeri national grid and a water treatment plant. Only minimal capital expenditure is now required to sustain its operations. Mining and exploration rights are until March 2027 which can be extended for a further five years.
The Company’s tailing management facility is situated approximately 4.5 kilometres from the Company’s processing facilities at Gedabek and is a downstream rock fill embankment. There have been four construction phases, and a final wall raise is being carried out in two stages, the first of which was completed in 2024. The Company has committed to implement the Global Industry Standard on Tailings Management (‘GISTM’) by the end of 2026.
Infrastructure
The Gedabek Contract Area benefits from excellent infrastructure and access. The site is located adjacent to the town of Gedabek, which is connected by good metalled roads to the regional capital of Ganja. Baku, the capital of Azerbaijan, is to the south and the country’s border with Georgia to the north, are each approximately a four to five hour drive over good quality roads. The site is connected to the Azeri national power grid.
Water management
The Gedabek site has its own water treatment plant which was constructed in 2017 and which uses the latest reverse osmosis technology. In the last few years, Gedabek town has experienced water shortages in the summer and this plant reduces to the absolute minimum the consumption of fresh water required by the Company.
Tailings (waste) storage
Tailings are stored in a purpose-built dam approximately seven kilometres from the Group’s processing facilities, topographically at a lower level than the processing plant, thus allowing gravity assistance of tailings flow in the slurry pipeline. Immediately downstream of the tailings dam is a reed bed biological treatment system to purify any seepage from the dam before being discharged safely into the nearby Shamkir river.
Gilar underground mine
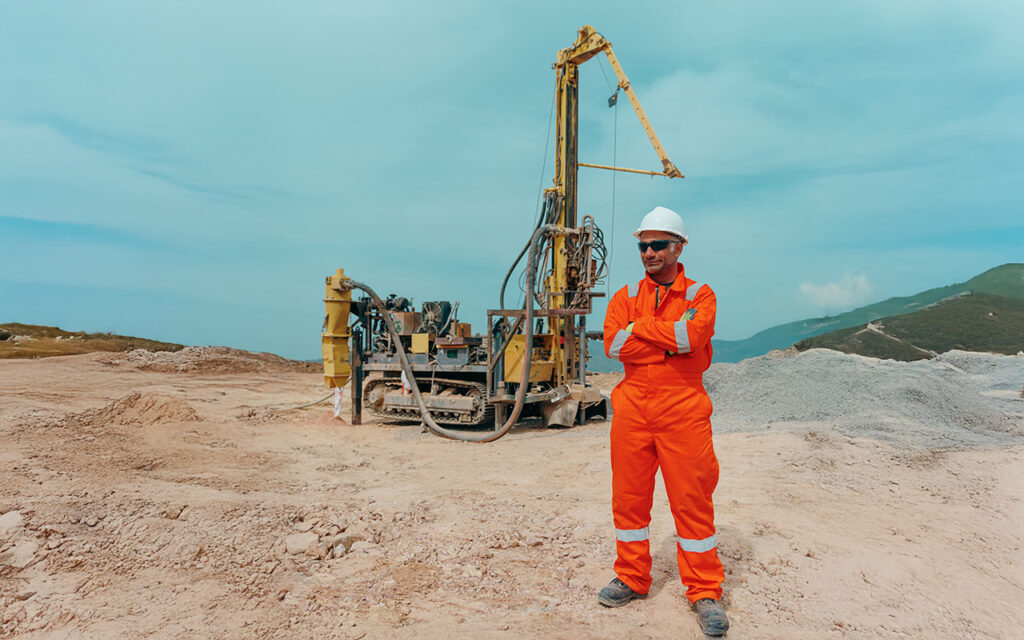
Gilar is a major new underground copper and gold mine in the Gedbek contract area, located approximately seven kilometres from the Company’s processing facilities and close to the northern boundary of the Gedabek Contract Area. The Group commenced developing the Gilar underground mine in late 2022 following exceptional drilling results in the south of the area.
The Gilar mine comprises two underground tunnels, a main production tunnel and a second tunnel for ventilation. A spiral accesses the ore body. The planned lengths of the production and ventilation tunnels are 1,461 metres and 774 metres respectively. The walls of the tunnels are supported by steel arches and shotcrete where necessary due to soft rock. Water encountered underground is being pumped from the mine into a settling pond constructed near the entrance to the mine. The development of Gilar was substantially completed in the first quarter of 2025 and the first ore extracted in March 2025.
Gilar started production in May 2025.A Caterpillar mining fleet for Gilar, consisting of three R1700 underground loaders and two 9800 UMA underground loaders, was acquired in late 2023. Gilar mine development continued throughout the year and was substantially completed by the end of 2024. The surface infrastructure supporting the tunnelling was also completed in 2024.
Mineral resources of Gilar
The maiden JORC mineral resources estimate for the Gilar deposit confirmed 6.10 million tonnes of mineralisation with average grades of 0.88 per cent. copper and 1.30 grammes of gold per tonne. The in-situ mineral resources are 54,000 tonnes of copper, 255,000 ounces of gold and 46,000 tones of zinc.